

Optogait is a state of the art system of analysis that brings a proven philosophy of assessment to injury prevention and rehabilitation. Classically, contact gait analysis has been precise, informative, and costly. This last attribute has limited its use to large biomechanical institutes. To control costs, simple contact pads have been employed. Contact pads, however, cannot assess dynamic motion. Optogait’s innovative design affords doctors, therapists, and researchers the ability to become their own high-tech laboratories; contact analysis is now affordable and portable.
Systems range from one to 100 meters. When paired with a standard treadmill, all aspects of the gait cycle can be studied. Parameters (e.g., contact time, flight time, and pre-swing) can be measured to .001 of a second. Left and right differentials are recorded. Precise, objective data is correlated to determine extent of injury and effectiveness of treatment.
All data is displayed in real time thru the software platform (affording instant decisions on treatment protocols) and paired with both lateral and sagittal video analysis. Data is stored over time, affording the clinician the ability to determine effectiveness of treatment. Injury prevention is enhanced via objective data, showing increased asymmetrical tendencies before pain sets in. Chronic injuries are addressed via gait-empowered differentials, identifying the root cause of malingering problems. All aspects of dynamic motion are recorded to ensure your patient is functioning at his/her highest level.
One meter system on treadmill: Have the patient walk at a slow speed. Observe the parameters of the gait cycle in real time. Make left and right comparisons of contact time, flight time, swing, etc. As you increase your patient’s speed, note if asymmetries are improving or worsening. When maximum efficiency is realized, record asymmetries and the treadmill’s speed. This efficient ‘rhythm of gait’ is a good starting point for clinical intervention. Footwear, orthotics, conditioning exercises, etc. may be employed to enhance patient symmetry. Pending the patient’s needs, gait protocols can be performed at any speed.
One meter system on floor:
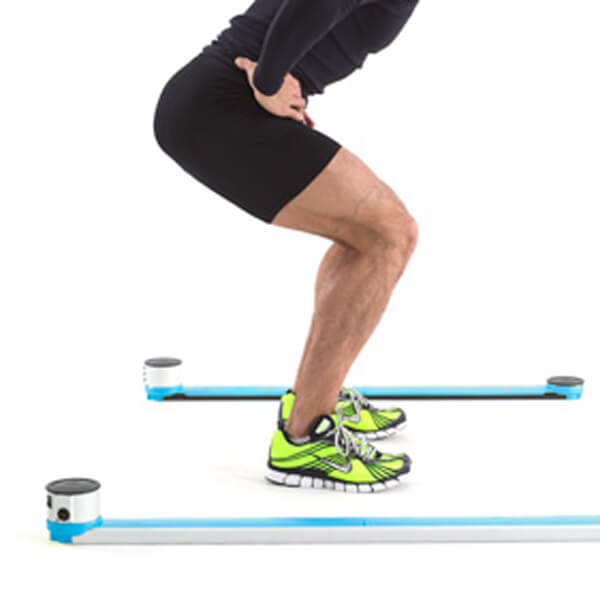
Larger installations of five meter or plus allow the patient to walk or run through the machine on nearly any surface. Again, all parameters of gait are easily measured. Differentials, left and right, are noted. Speed and acceleration of each leg can be measured. Every motion in all directions can be analyzed for symmetry. The length of the system is flexible. The width of the system can be a maximum of six yards. This affords the clinician the ability to lay out various ‘obstacle courses’ to analyze their patient’s gait.
Surface EMG testing is made simple. There is no need for contact pads under the patient’s feet to correlate data. By interfacing with Optogait, all data is easily recorded and evaluated.
The above tests are just a few of the many protocols that can be performed to analyze patients. Sub-clinical injuries can no longer hide; precise, effective treatment is ensured.
The interface with which the OptoGait system is managed is divided into three main sections: Patients data, Tests and Results.
Patients
This is the section in which the profiles of the patients are created and catalogued. Each profile can contain numerous items of data (personal data, notes, photos of the patients, etc.). Each individual can be inserted into one or more groups or subgroups. The patient data is therefore completely open to modulation/modification in accordance with the user’s needs and, if required, can be imported from other formats (e.g., Excel).
Tests
This is the nerve centre of the software. It is the part to access in order to design and configure new tests (jump, reaction, running, etc.) and to perform tests, choosing from the predefined tests and those created by the user. It is also possible to program sequences of tests so that one or more patients can perform several tests.
During performance of the test, the user receives three types of feedback in real time: numerical, graphical and video (from one or two webcams). Once the test has been confirmed, all three types of data are saved and remain available for immediate review or future consultation. If the user so requires, information not of interest can be temporarily hidden (for example, if it is the video that is important for the user, the images can be viewed full-screen and the numerical data can be hidden).
Results and video analysis
In this section it is possible to retrieve previously performed tests at any moment. The images can be compared with the data (numerical as well as graphical). In addition, the video support is of great help to the user in “remembering” how the patient performed a test weeks or months before. Thanks to the “video memory” any anomalies in the numerical data are easily identified.The video images are synchronised with the acquired values. This makes it possible to ascertain exactly what happened when a certain data item was acquired (for example, if a contact time seems too long, the cause of this can be determined by observing the images at the moment the value was recorded).
The speed of the video can be reduced down to “frame by frame” or still picture. A video analysis utility is also included. This makes it possible to draw on the still picture, thanks to various graphic tools (lines, arcs, circles, ruler, goniometer, etc.). In the Results section, it is also possible to compare two or more tests without the help of extra software. For example, it is possible to ascertain the performance of a patient over a period of time or compare the results of tests performed by two or more different patients. All the data (numerical as well as graphical) can be printed or exported in the most common formats.
Report
There are several reports including a summary ("Gait Report") that allows you to quickly see any difference between right foot and left foot, often index of asymmetries.
The software is currently available in 7 different languages (english, italian, german, french, spanish, japanese, chinese).
The Gait analysis is the study of human locomotion, using the eye and the brain of observers, augmented by instrumentation for measuring body movements, body mechanics, and the activity of the muscles. Gait analysis is used to assess, plan, and treat individuals with conditions affecting their ability to walk. It is also commonly used in sports to help athletes run more efficiently and to identify posture-related or movement-related problems in people with injuries.
By acquiring the fundamental parameters of their patient’s gait, OPTOGAIT allows physical therapists, doctors, and researchers to quantitatively measure underlying mechanical inefficiencies and target any problematic areas. With this information, they can develop the right exercises to properly address the patient’s specific needs.
The Gait Report provided with the OptoGait software
In the figure below we see the main features of "gait cycle" and explain the key terms used in Gait Analysis that you'll find in the OptoGait software.
The Gait Cycle begins when the heel of one foot touches the ground and ends when the same foot, after having executed one step, is set down. The cycle begins with the Stance phase (the heel-to-toe contact sequence of the foot) and continues with a Swing phase, where the foot is suspended and proceeds in the air (on average the stance phase accounts for 60% and the swing phase for 40%).
Each gait cycle consists of two phases, where both feet are in contact with the ground, called Double Support. The first Double Support (DS1 in Figure 1 refers to the right foot) is also called ‘Load Response’, whereas the second (DS2) is called ‘Pre Swing’). When only one foot is in contact with the ground, this is called Single Support.
The Step is the distance between the tip (toe) of two subsequent feet or the distance between the heel of two subsequent feet (in the software you can choose how to calculate setting the parameter ‘Step length calculation’).
The Stride is the distance between the tip of two subsequent footprints of the same foot or the distance between the heel of two subsequent footprints of the same foot (always depending of the "Step lenght calculation" parameter).
The Speed is the relation between the distance between the two feet and the sum of the first Contact time (Tc) and the Flight time (Tf).
The Acceleration is calculated as the relation between speed delta of the two steps and the sum of the contact and flight time.
The Stride Angle is the angle of the parable tangent deriving from the movement of a stride (L=stride length, h=height to which the foot is risen).